
For the last twenty years, software cost was easy to forecast. You counted heads, multiplied by a monthly licence fee, and the number moved only when you hired or let someone go. Finance could set it once a year and forget about it.
Agents break that. When software does the work instead of helping someone do it, the bill follows the work. A quiet month costs less. A busy month, or an agent stuck in a retry loop at 2am, costs more. AI spend has stopped behaving like an overhead line and started behaving like cost of goods sold.
Microsoft's announcement last week makes this official for millions of Microsoft 365 customers. We've been tracking the shift for several weeks, and the conclusion is the same one we keep reaching with clients: AI cost is becoming an operating metric. The teams that win will be the ones who can say what a finished piece of work costs, and whether that is better than before.
On 25 September, Microsoft introduced the new Copilot with Home, Code and Autopilot. The product news got the headlines. The billing change is the bigger story. According to VentureBeat's write-up, "everyday use remains covered by a subscription, while Cowork, Code and Autopilot require that subscription plus charges for Copilot Credits." The Decoder described it as Microsoft "pulling back from subsidizing AI usage through flat-rate plans."
Alongside the pricing, Microsoft shipped what it calls FinOps for AI. The Microsoft 365 message centre notice (MC1479276) lists the controls:
That last item is the one to watch. Spend caps protect you from a bad month. Outcome reporting tells you whether the money is buying anything. VentureBeat noted that the announcement does not explain the measurement method well enough to treat those dashboards as proof of financial return. Which is fair. Microsoft can count credits. It can't know what a "good outcome" is in your business. You have to define that yourself.
Microsoft is not alone. GitHub moved Copilot to usage-based AI Credits on 1 June 2026, explaining that "a quick chat question and a multi-hour autonomous coding session can cost the user the same amount" under the old model. Intercom, which pioneered paying per AI resolution, moved Fin from resolutions to outcomes in March. The direction across the market is consistent.
The shift fits in two lines.
Under the seat model, the vendor gets paid whether or not the software helps. Under the outcome model, cost tracks volume and quality of work. That changes who carries the risk and what you need to measure.
The failure mode in the last row is no longer hypothetical. In June, TechCrunch reported that Uber capped AI coding tool spend at $1,500 per employee per month after exhausting its annual AI budget in four months. Its COO said it was "very hard to draw a line" between AI usage and measurable business outcomes. A cap stops the bleeding. It doesn't tell you which of that spend was worth it.
Most AI cost conversations start with the model: token prices, cost per call, which model is cheapest. Those numbers matter to the engineer configuring the system. They're close to useless for the person deciding whether the system was worth building.
Even Microsoft's own architects make this point. A July post on the Azure Architecture Blog, Token Economics in Practice, opens with the line: "Token prices alone are a poor economic model for agents."
Here's why. An agent can be cheap per run and still lose money, because the expensive parts of the workflow sit outside the agent: the person who checks its work, the customer who calls back because the answer was wrong, the exception that lands on a senior manager's desk on Friday afternoon.
Multi-step work makes this worse. If each step in an agent's task succeeds 95% of the time and the steps are independent, the chance of a clean run falls fast as steps are added. This is basic probability (0.95 multiplied by itself once per step), and it shows why long agent chains create human review work that never appears on the AI invoice.
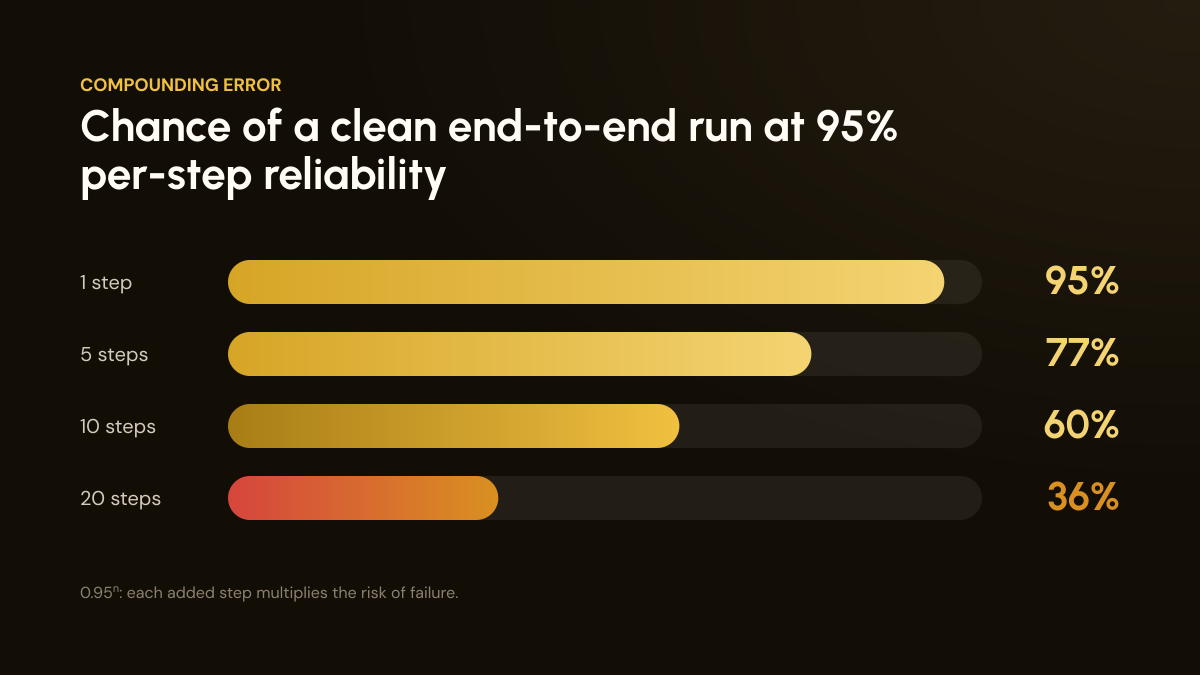
Illustrative calculation: 0.95 to the power of the number of steps, assuming independent steps. Real workflows vary, which is why you measure success rate directly.
So we call this Workflow Unit Economics rather than agent unit economics. The name keeps attention on the business process (closing a support ticket, say, or paying a supplier) and off the technology doing part of it. An agent is one component. The workflow is what your customer experiences and what your P&L records.
For any AI-native workflow, we measure eight things. Then we compare every one of them with the old process. A number on its own tells you very little. A number next to its baseline tells you whether to scale, fix or stop.
Two of these deserve a closer look.
Cost per completed outcome only works if "completed" means something. For a support workflow, it might be "customer issue resolved with no repeat contact within seven days." For an invoice workflow, "posted to the ledger correctly with no reversal." Write the definition down before launch. If you let the agent's own success signal define completion, you'll measure activity and call it value.
Intercom ran into a version of this at vendor scale. When it changed Fin's billing from resolutions to outcomes, it redefined the unit as when "Fin successfully completes the action it was configured to perform," including handoffs to people. Its reasoning: "solving a customer problem with full automation isn't always appropriate." If the vendor whose business depends on this metric had to rethink what counts, so will you.
Every AI business case looks good on AI execution cost alone. The test is what happens once you add the time people spend checking, fixing and approving. A workflow with a low success rate can cost more per outcome than the manual process it replaced, even when the AI itself is almost free.
This is why we tell clients to track human intervention rate from day one, alongside the process baselines we covered in How to Measure AI's Impact. If you can't see where people are stepping in, you can't see your real costs. Process mining is one way to get that visibility without asking your team to log every minute by hand.
Here's how the comparison looks for a typical workflow in a 25-person professional services firm processing around 400 supplier invoices a month. The figures below are our own illustration, built to show the method rather than to report a specific client result. Swap in your own numbers.
A few things stand out. The AI execution cost is the smallest line on the page. Human review cost is what decides whether the business case works. And the AI-native success rate is lower than the human one, which is fine as long as the intervention path is fast and cheap. If intervention took 20 minutes instead of 6, most of the saving would disappear.
The capacity figure is the one to be honest about. £2,150 a month of released time only becomes value if that time goes somewhere useful. If it does, this is how you scale without adding headcount. If it doesn't, it's a number on a slide.
Klarna is the best-known example of agent economics at scale, and the most useful for this reason: it shows both sides.
In early 2024, Klarna said its OpenAI-powered assistant handled 2.3 million conversations in its first month, two-thirds of all customer service chats, doing the work of 700 full-time agents. Average resolution time dropped from 11 minutes to 2, repeat inquiries fell 25%, and the company projected a $40 million profit improvement for the year.
Judged on cost per conversation, cycle time and deflection, that was a clear win. Then in May 2025, Klarna began recruiting human agents again. CEO Sebastian Siemiatkowski told Bloomberg that "really investing in the quality of the human support is the way of the future for us," and acknowledged that focusing on cost had lowered quality.
In Workflow Unit Economics terms, Klarna had strong numbers for AI execution cost, cycle time and intervention rate. The weaker signal sat in business value generated: what a poor experience does to retention and trust is slower to show up and harder to measure. A cost-per-conversation dashboard would have looked great the whole time.
The lesson for smaller firms is to design the human escalation path as carefully as the automated path, and to keep business value in the same view as cost so neither can drift unnoticed.
Most organisations go through recognisable stages in how they manage AI cost. The State of FinOps 2026 data suggests nearly everyone has reached the early ones and very few have reached the last. The report notes that mature practices are starting to focus on "unit economics, AI value quantification, and influencing technology selection," and describes this as an emerging area.
Microsoft's new controls will move many organisations from stage 1 to stage 3 almost overnight. Stages 4 and 5 still need you to define outcomes, record baselines and capture human time, which no vendor dashboard can do for you.
Pick one workflow that is high volume, rule-heavy and currently manual. Then work through these steps.

Then set a model policy. The FinOps Foundation's guidance is to "avoid using the most complex and expensive models for every task." Microsoft's group-level model access and auto-routing make this easy to put into practice: route routine runs to cheaper models and save frontier models for the work that needs them. Your unit economics will tell you where that line sits.
If you're still at the stage where pilots aren't reaching production, start with why most AI pilots never scale. Workflow Unit Economics is how you make the case for the ones that should.
Know which workflows are worth the spend
The AI Operating System Scorecard shows where your business stands on measurement, workflow design and governance, so you can see which processes are ready for outcome-based economics and which need fixing first.
Take the AI Operating System Scorecard →
FinOps for AI applies financial operations discipline (visibility, allocation, optimisation and accountability) to AI spend such as tokens, credits and agent runtime. The FinOps Foundation points out that the basic price-times-quantity logic still applies, but the meters are different and value is harder to pin down. Microsoft now uses the same term for its Copilot spending controls.
Tracking AI spend tells you what you paid the vendor. Workflow Unit Economics tells you what a finished piece of work costs once you include human review and exceptions, how that compares with the old process, and what business value it produced. AI spend is one of its eight inputs.
Yes, and they have an advantage. If you use Microsoft 365, GitHub Copilot or most agent platforms, usage-based billing has already reached you. A small team can baseline one or two workflows in a few weeks, which is far faster than a large enterprise can, and use that to decide where AI earns its place before costs scale.





The AI Operating System Scorecard is a diagnostic tool that measures whether your business is structurally built to make AI compound, across nine dimensions including how decisions get made, how clearly your processes are defined and how your team is using and integrating AI.
The output is a clear view of where your biggest leverage gaps are and where to focus first.


One practical AI operating-system insight bi-weekly.
No fluff, no spam.

© 2026 AV Ventures Limited trading as Orbflo | All Rights Reserved