So many businesses have a visibility problem that AI is now making expensive, not just an AI implementation problem.
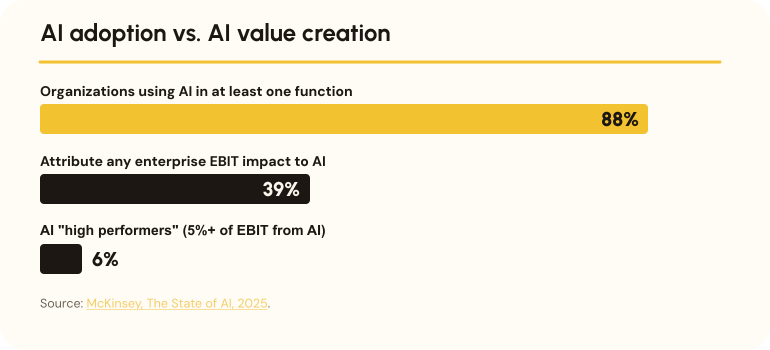
Eighty-eight percent of organizations report using AI in at least one function, according to McKinsey's 2025 State of AI survey. Only 39% can point to any enterprise-level EBIT impact from it, and most of those put the number under 5%. Just 6% qualify as what McKinsey calls AI high performers, meaning AI drives 5% or more of their bottom line. Separately, BCG's research on the widening AI value gap puts the share of companies generating substantial value from AI at around 4%, even as adoption approaches saturation.
This is what happens when you bolt a fast engine onto a workflow nobody has mapped, reviwed, challenged and redesigned. Value Stream Mapping (VSM), a decades-old lean manufacturing discipline, is the tool that shows you where the workflow is broken before you spend money accelerating it. Combined with the Theory of Constraints, it tells you exactly where AI will pay back and where it will just produce waste faster.
The pattern behind the McKinsey and BCG numbers shows up the same way almost everywhere: a team drops a generative AI tool into an existing process without changing the process, and the tool speeds up one part of it while the rest stays exactly as slow. We've written before about why this happens at the pilot stage specifically, in our look at why 70 to 95% of AI pilots never scale. The short version: the technology was never the constraint. The process was.
VSM is a visual method for documenting and analyzing the end-to-end flow of information and work needed to get a product or service to a customer. It comes out of Lean, Six Sigma, and Agile practice, and it covers every action in that flow, value-adding and non-value-adding alike, from the moment a customer request comes in to the moment it's delivered. The goal is a lean operation where every step earns its place.
Lean thinking itself is a specific departure from traditional production logic, and the contrast matters once you start applying it to knowledge work rather than factories.
On a factory floor, waste is visible. Parts pile up at a congested work cell and everyone can see it. In knowledge work and digital operations, the equivalent pile-up happens inside Slack threads, shared drives, ticket queues, and approval inboxes, and almost nobody can see it. That's the reason delays in knowledge work usually aren't in the work itself. They're in the gaps between handoffs, and those gaps frequently account for the majority of total lead time.
The fastest way to waste a mapping exercise is to start it without boundaries. A SIPOC framework (Supplier, Input, Process, Output, Customer) fixes that before anyone touches a whiteboard. You name who supplies the raw inputs, what's being fed into the process, the core sequence of steps, what comes out the other end, and who receives it. An order-processing pipeline, for instance, has the inventory system and the customer as suppliers, the order and inventory data as inputs, receiving-checking-confirming as the steps, delivery notes and confirmation emails as outputs, and the end customer and logistics team as the customers of the process. That single page keeps a mapping team from drowning in detail before they've agreed on what they're even mapping.
Once the boundaries are set, the mapping itself follows a fairly disciplined sequence, borrowed directly from manufacturing kaizen practice and adapted for how knowledge work runs.

A cross-functional group, usually around ten people spanning managers, supervisors, and the front-line operators doing the work, picks a process family (a set of products or services that share most of their processing steps) and walks the flow the way it happens, not the way the org chart says it happens. This is called a "gemba walk" where you collect real cycle times, wait times, and queue sizes directly from the people doing the work, not from whoever wrote the SOP three years ago. The current-state map plots that reality, including a lead-time ladder that separates value-adding time from everything else. Only after that does the team draw a future-state map with the bottlenecks marked and the automation candidates flagged, and turn it into a roadmap with real investment and timeline numbers attached. Our practical blueprint for redesigning business processes for AI covers this handoff from mapping to redesign in more depth.
Lean practice groups waste into eight types under the acronym DOWNTIME: defects, overproduction, waiting, non-utilized talent, transportation, inventory, motion, and extra processing. Mary and Tom Poppendieck's lean software framework translates that into software terms (partially done work, feature creep, handoffs, task-switching, defects, delays). In an AI-enabled operation, those same categories show up again, just wearing different clothes.
Eliyahu Goldratt's Theory of Constraints makes a simple claim: the throughput of any connected system is set entirely by its single weakest link. Improve any other step and you haven't improved the system, you've just moved the pile of unfinished work somewhere else and added cost getting it there.
This is exactly what's happening inside a lot of AI rollouts right now. A team gives developers an AI coding assistant, and local output jumps. If the downstream QA or security review is still manual and capacity-constrained, the end-to-end cycle time doesn't move at all. The work just backs up in front of the reviewer's desk. Goldratt's drum-buffer-rope model describes the fix: the bottleneck (the drum) sets the pace, and a rope limits how much new work gets released so it matches what the drum can process. What AI does, without that discipline, is cut the rope. Upstream work gets generated at machine speed and floods the one checkpoint that's still running at human speed. We've written separately about what this looks like at the agent-deployment stage, where 79% of companies adopt AI agents but only 11% get them into production. The gap is almost always this same bottleneck, just further downstream.
Google's DORA research program retired its old four-tier scoring system (elite, high, medium, low) in its 2025 report and replaced it with seven team archetypes, built from a cluster analysis of throughput, stability, burnout, and friction data across nearly 5,000 respondents. This enables teams to figure out which failure mode you're mapping against.
The 2025 DORA report's central finding is that AI acts as an amplifier. It makes strong teams stronger and struggling teams more visibly stuck, and it has a positive relationship with delivery throughput this year but still a negative one with stability. Without a map showing which archetype you are, "adopt more AI" is a coin flip.
More than 80% of developers surveyed in the 2025 DORA report believe AI has meaningfully increased their productivity. A separate, tightly controlled study from METR tells a less comfortable story: in a randomized trial, experienced open-source developers using current AI coding tools took 19% longer to complete real tasks on codebases they knew well. Before starting, they predicted AI would speed them up by 24%. After finishing, measurably slower, they still estimated AI had made them 20% faster.
That gap is the whole argument for mapping instead of guessing. Feelings about velocity are not a flow metric. If a team is scaling a process that feels faster while accumulating rework, technical debt, and review backlog, VSM is the only way to catch it before the balance sheet does.
A workflow mapping exercise fails just as often from being too coarse as too fine. One process-first framework for AI adoption, VSM2AI, argues the useful zone sits between five and thirty minutes per mapped step. Anything longer is really several decisions bundled together, and trying to automate the bundle means building brittle, overengineered orchestration. Anything shorter usually isn't worth the fixed cost of an API connection, an error-handling path, and ongoing maintenance.
It also helps to separate two things people conflate constantly: a capability map, which describes what an organization does, and a value stream map, which describes where, when, and how those activities happen to produce an outcome. AI intervention decisions belong on the value stream, not the capability map, because that's where the friction lives.
Once the current-state map exists, Capstera's framework for AI business architecture offers a useful way to classify each step by how AI should engage with it, rather than defaulting to "automate everything."
Paired with that is a decision-rights layer:
Assigning one of these to every "Automate" or "Transform" tag on the map is what keeps a redesign from quietly becoming ungoverned.
With the current state mapped and tagged, the redesign work follows a three-part sequence that one operations consultancy, Green Everest, frames as the 3R model:
Running underneath every redesigned step is the human-AI handoff loop, and it's worth making explicit rather than assuming everyone already agrees on it.

A task gets delegated to AI, the AI generates an output, a human reviews it, overrides it where judgment demands, escalates the cases that exceed the system's boundary, and the whole loop learns from every one of those interventions so the next pass needs less correction. Skipping the "Learn" step is the most common failure. Teams build the loop, run it for a quarter, and never feed the override data back into anything.
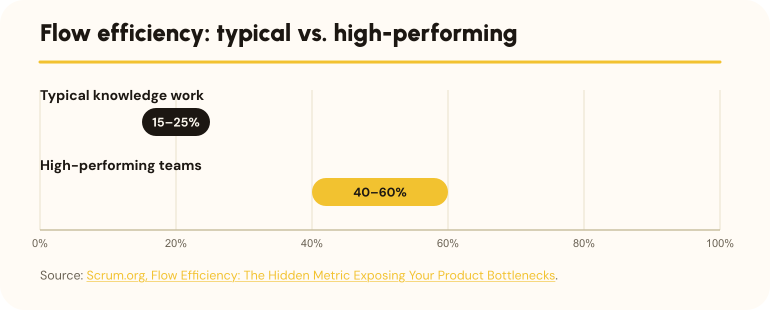
Flow Efficiency is the one number that matters most, and it's simple: active work time divided by total lead time, times 100. Most knowledge work sits at 15% to 25%. High-performing teams get to 40% to 60%. Nobody sustainably runs at 100%, and some of that "wait" time, like a considered code review, is adding value even though it isn't active work.
Three other metrics round out the picture. First Pass Yield (FPY) is the share of units that clear a single process step defect-free on the first try, with no rework. Rolled Throughput Yield (RTY) multiplies FPY across every step in the stream, which is why it's the truest read on systemic health: a process can look fine at each individual gate and still be quietly terrible end to end once you account for every hidden rework loop. And Cost of Delay, daily value opportunity multiplied by delay duration, turns queue time directly into a dollar figure, which tends to get a redesign funded a lot faster than a diagram does.
A software team in the campaigns and rewards division of a gaming company, in an account the engineers behind it later shared publicly, found their flow efficiency sitting at just 32%, with most of the loss coming from clarification loops and grooming overhead rather than coding time. Their AI coding assistants were making things worse before they made them better, generating incorrect code against vague user stories like "as a user, I want to receive rewards." The team's fix was replacing loose user stories with structured engineering specs that gave the AI explicit inputs, outputs, and edge cases, with a human spending up to two hours refining each spec before it reached the assistant.
Active coding time barely changed across all three stages, however the waiting changed. That's the pattern our own roundup of verified AI agent ROI cases keeps turning up too: the win is almost never in the generation step.
Eli Lilly ran the same logic at enterprise scale. After applying value stream mapping to its DevOps pipelines, the pharmaceutical company reported roughly $16 million in annual savings, in place since 2017. It then carried the same discipline into its clinical trial data operations, where loading and reconciling report data from global trial sites into the central warehouse normally took five weeks. Once COVID-19 trial data needed processing, the redesigned pipeline did it in two days, driven by removing redundant manual validation checks rather than by adding a new tool on top of the old process.
There's a sharper edge to skipping this work once AI agents get connected to real systems. In early 2026, security researchers at CodeWall ran a controlled, responsible-disclosure red-team exercise against McKinsey's internal AI platform, Lilli. Within two hours, their AI agent chained together unauthenticated API endpoints and a SQL injection flaw to gain full read-write access to the production database, reaching 46.5 million internal chat messages, 728,000 files, and 57,000 user accounts. McKinsey patched the flaws within hours of disclosure, and a third-party forensic review confirmed no client data was accessed by any unauthorized party. No breach happened. But the exercise proved the mechanics work, and it worked because the platform's own API surface had never been mapped and audited with the same rigor as the workflows sitting on top of it. Value stream re-engineering that connects proprietary data to new AI tooling has to treat authentication, input parameterization, and zero-trust boundaries as gates on the map, not afterthoughts bolted on once something goes wrong.
Where to start
A value stream map only tells you the truth if you're honest about where you're starting from. The AI Operating System Scorecard is Orbflo's diagnostic for that, built on the same research rigor we cover in the research behind the Scorecard: nine capabilities, including decision authority, process clarity, and AI integration, scored against how your business runs today.
A process map documents the steps in a workflow. A value stream map documents the same steps but adds the data that makes the map useful for a redesign decision: cycle time, wait time, who touches each handoff, and where value is actually being added versus where a step exists only because it always has. A process map tells you what happens. A value stream map tells you where it's slow and why.
A focused gemba walk and current-state map for a single process family can be done in a hours to a day with the right five to ten people in the room, most of them the front-line operators doing the work rather than only their managers. The future-state design and implementation roadmap typically take longer, since they depend on how many systems and approvals are involved in the handoffs you find.
No. The SIPOC framework, the current/future state mapping steps, and the DOWNTIME waste categories are all learnable from public documentation in an afternoon. What determines whether the exercise works is whether the right people show up and describe the process honestly, including the parts that make them look bad, rather than whether the facilitator has a certificate.





The AI Operating System Scorecard is a diagnostic tool that measures whether your business is structurally built to make AI compound, across nine dimensions including how decisions get made, how clearly your processes are defined and how your team is using and integrating AI.
The output is a clear view of where your biggest leverage gaps are and where to focus first.


One practical AI operating-system insight bi-weekly.
No fluff, no spam.

© 2026 AV Ventures Limited trading as Orbflo | All Rights Reserved